Web Mapping might be a difficult thing to do for most GIS user, because it needs web programming skills such as Javascript, HTML, PHP, etc. On the other hand web mapping is a nice tool to visualize GIS information and can be shared and accessed easily by many people through a web page. This tutorial will discuss how to make a simple web mapping without any single code in QGIS. For this tutorial I am using QGIS 2.18.
Installing Web Mapping Plugin
The magic behind this web mapping tutorial is QGIS2Web Plugin which will export map layers in QGIS canvas into a web page. Therefore, firstly we have to install this plugin. To install QGIS2Web plugin can be done as follow.
1. In the toolbar menu. Open Plugin > Manage and Install Plugins. As in figure 1.
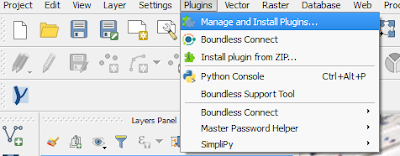 |
| Figure 1. Manage and Install Plugins |
 |
| Figure 2. Install qgis2web plugin |
Add Data to QGIS Map Canvas
In this tutorial, I used earthquake data that can be downloaded from USGS Earthquake Catalog. Download the data in csv format or geojson. Add the data into QGIS map canvas as in figure 3. |
| Figure 3. Earthquake point dataset |
 |
| Figure 4. Layer Properties Window |
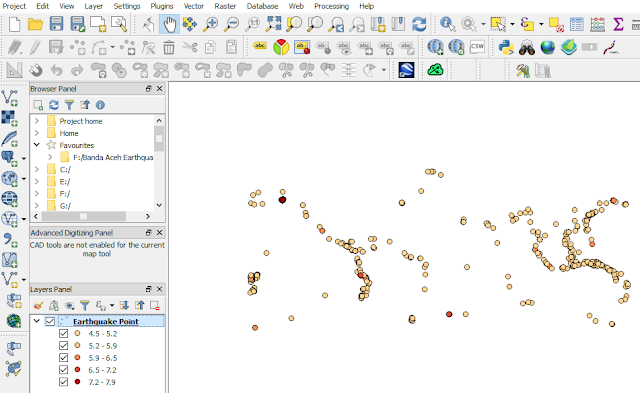 |
| Figure 5. Earthquake point classification based on magnitude |
Create A Web Mapping Application
If the map is ready, then it's time to build a web mapping application using qgis2web plugin. The plugin can be found in the web menu, as in figure 6. Soon you will see the plugin window like figure 7. | |||||||||||
| Figure 6. qgis2web plugin |
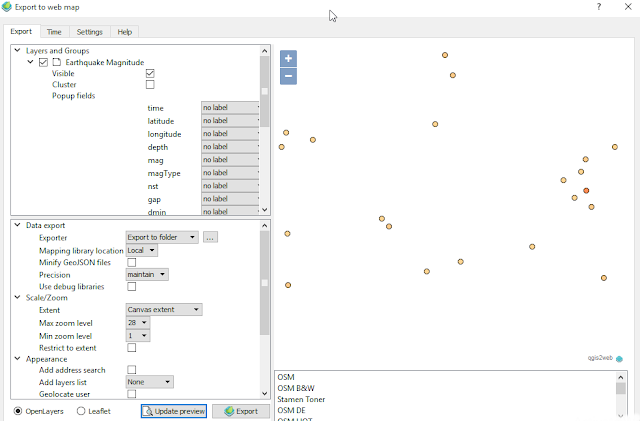 |
| Figure 7. Export to web map window |
- Layers and Groups section. It control how a layer will be displayed in the web map, including the pop up fields option. In this part we can also cluster a set points.
- Data Export. This part gives some options for exporting the map into a web map, such as: Location of exported web map files, mapping library location, minify GeoJSON file, etc.
- Scale/Zoom. This section control the map extent including zoom setting.
- Appearance. In this section we can add some tools to the web map such as: address searching, layer list, measure tool, pop up, user geolocation. Moreover we can set the extent of the web map in this part.
1. Firstly we have to choose web mapping library OpenLayers or Leaflet. For this case I used Leaflet because I think it is lighter and faster.
2. Our web mapping does not have any basemap. Let's pick one by choosing a basemap. For example I chose Open Street Map (OSM) in the list at right bottom. Then clicked Update preview. The web map will show like figure 8. There are some basemap available, just explore them and see the result which is fitted with your purpose.
 |
| Figure 8. Web Mapping with OSM basemap |
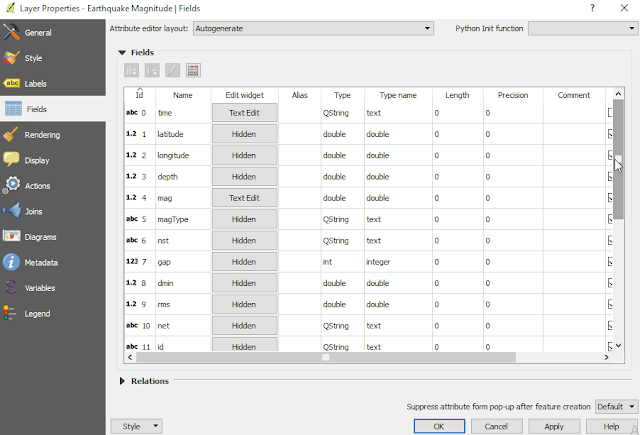 |
| Figure 9. Hide a fields in layer properties |
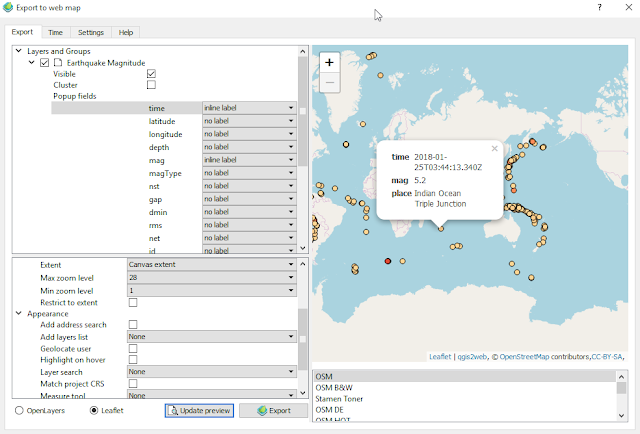 |
| Figure 10. Web map with pop up window |
Data export
Exporter : Export to Folder
Mapping library location: Local
Minify GeoJSON files: Checked (True)
Precision: Maintain
Scale/Zoom
Extent: Fit to layers extent
Max zoom level: 28
Min zoom level: 1
Restric to extent: Checked (True)
Appearance
Add address search: Checked(True)
Add layer list: Expanded
Layer search: place (Field name)
Measure tool: Metric
Template: Fullscreen
In figure 11 can be seen those settings in the plugin window. You can play with them and don't forget to click Update preview to see the result.
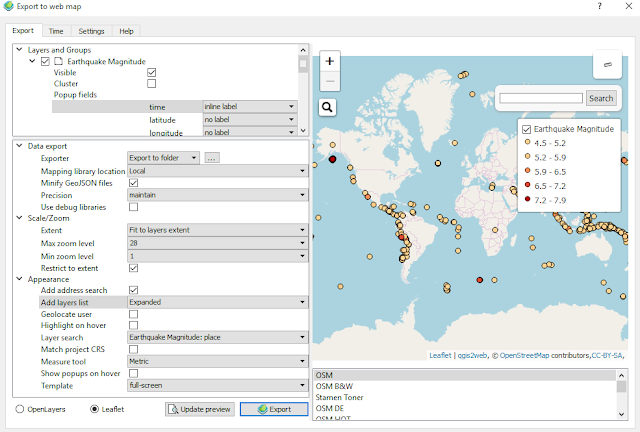 |
| Figure 11. Final qgis2web plugin setting for web mapping |
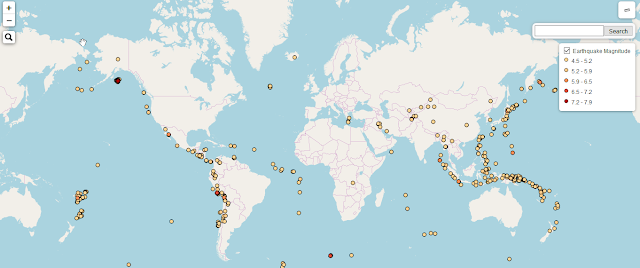 |
| Figure 12. Web Mapping is ready |

