QGIS 3.0 comes with 3D layer view which enable us to visualize GIS data in 3D. So we can get a more vivid visualization of a data which contains elevation or height information such as Digital Elevation Model (DEM). DEM contains elevation information of earth's terrain surface. It will be really cool to visualize DEM data in 3D to see terrain elevation difference of earth's surface as in figure 1, rather than seeing it on a flat surface. This tutorial will guide you how to visualize DEM in 3D with QGIS 3.0. In this tutorial I'm using QGIS 3.0 master candidate which can be downloaded from
QGIS weekly download.
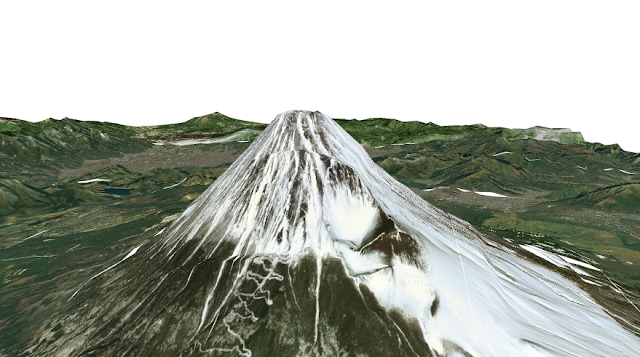 |
| Figure 1. DEM 3D Visualization |
Download DEM Data
SRTM is a very popular DEM data source which can be downloaded from USGS Earth Explorer or NASA Earth Data server. But in QGIS you can directly download SRTM DEM data using SRTM Downloader Plugin. You just need to add a data into QGIS map canvas then zoom in to an area that you want to get a DEM data. Read this tutorial
How to Download SRTM DEM Data in QGIS.
DEM 3D Visualization
After downloaded a DEM Data. Let's start to visualize it in 3D.
1. Add DEM data into QGIS map canvas as in figure 2.
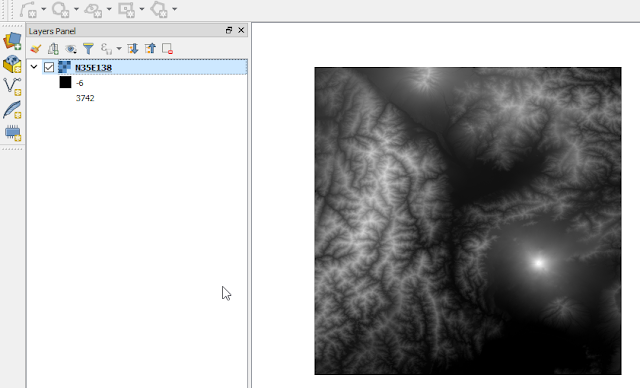 |
| Figure 2. DEM data in QGIS Map Canvas |
2. The data contains elevation information in each pixel. In figure 2, the DEM layer rendered in gray singleband. Let's make it more beautiful by changing its render type. To do this, open the DEM layer properties. In Style Option change Render type to Singleband pseudocolor. Then select a color ramp. The DEM data now seen like figure 4.
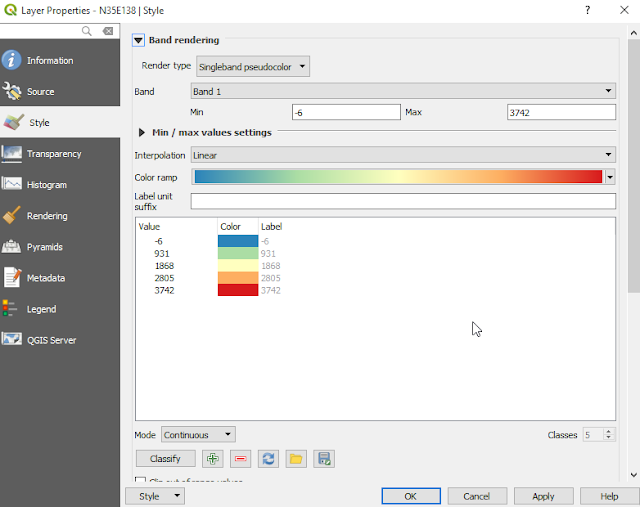 |
| Figure 3. DEM Layer Properties |
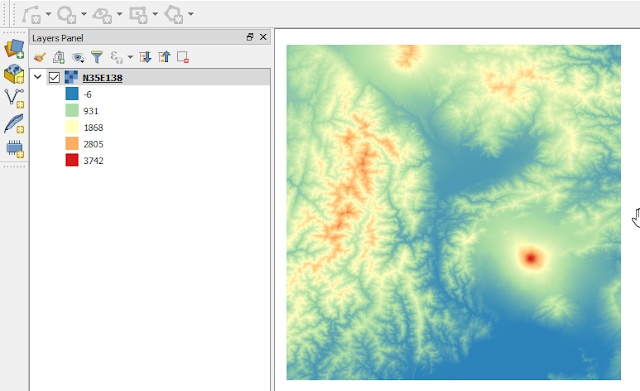 |
| Figure 4. DEM Data in Singleband Pseudocolor |
3. To visualize the DEM data in 3D. We do it in 3D Map View. You can find it in menu View as in figure 5.
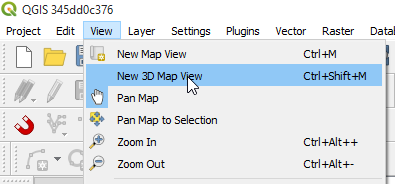 |
| Figure 5. 3D Map View Menu |
4. Suddenly might be you get an error like figure 6. That's because the 3D map view does not support unprojected coordinate system. In this case the DEM data has geographic coordinate system. We don't have to change the DEM data coordinate system, but just change the map view coordinate system. To do this click the right bottom QGIS window with current CRS. See figure 7
 |
| Figure 6. 3D Map View Error |
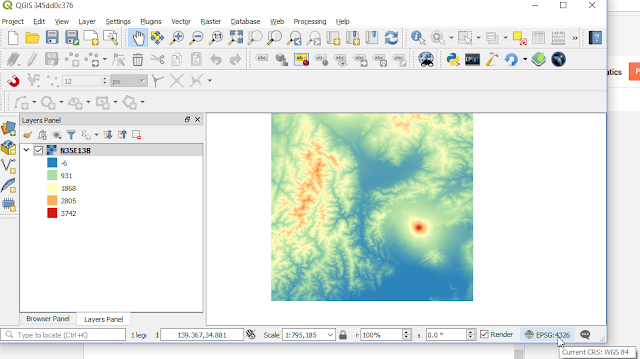 |
| Figure 7. QGIS Map Canvas with Geographic Coordinate System (EPSG:4326) |
5. Soon will appear the properties window. Change the coordinate system into a projected coordinate system like Mercator or Universal Traverse Mercator (UTM). I chose World Mercator, EPSG:3395.
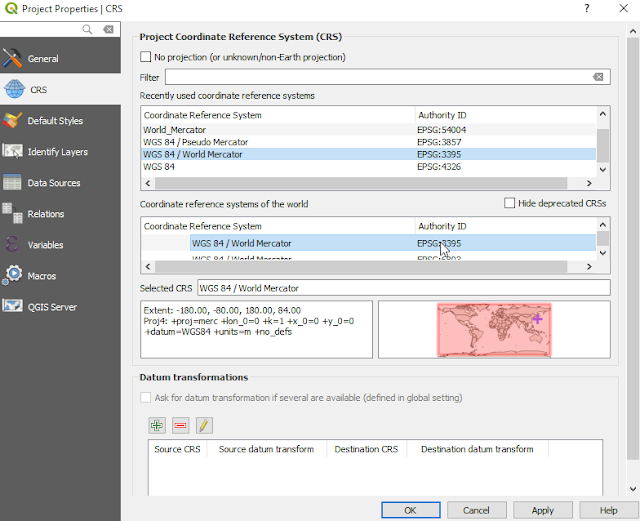 |
| Figure 8. Change a Project Coordinate System |
6. After changing coordinate system. Open again the New 3D Map View. The 3D map view window will appear as in figure 9. Hmm...It's flat, I can't see any 3D view. Don't worry try to rotate the DEM data with holding shift button on the keyboard + left mouse click. Move the mouse, you will see the DEM data rotate as in figure 10.
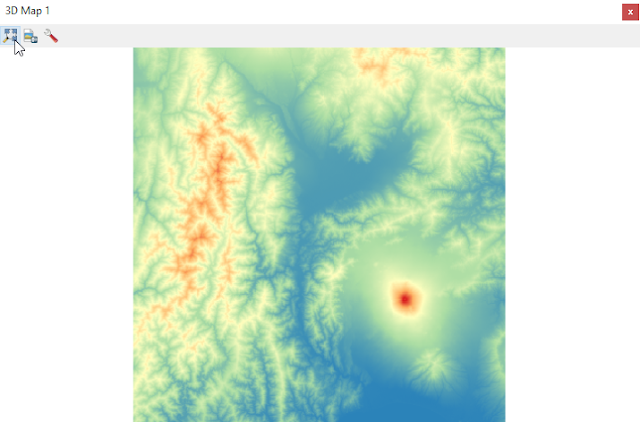 |
| Figure 9. DEM data in 3D Map View |
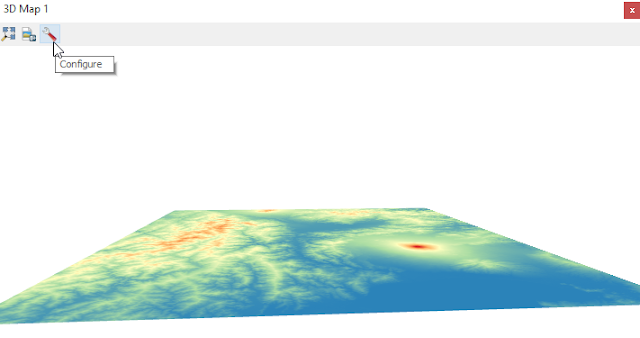 |
| Figure 10. DEM Data in 3D View after rotation |
7. Looks promising. But still I can't see a nice terrain surface. It's because the elevation terrain is not set.To do it, click Configure button. The configuration window will appear as in figure 11. Set Elevation to the DEM data, and change Vertical scale to some number, for example 2. Vertical scale is a scale to raise the terrain's elevation. Higher scale will raise the terrain higher. Then you will see the terrain as in figure 12. Play with it by zoom in/out and rotate.
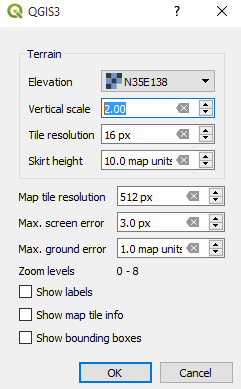 |
| Figure 11. 3D Map View Configuration |
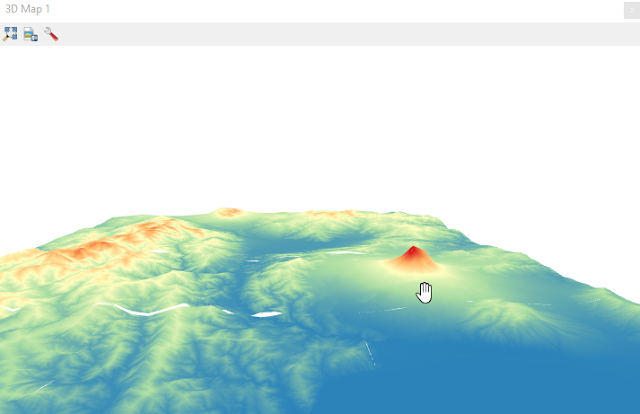 |
| Figure 12. DEM 3D Visualization |
8. Now let's add a satellite imagery layer. For exampe I added world satellite imagery layer from ESRI web map server. Read
how to add satellite imagery in QGIS. QGIS will automatically overlay the satellite imagery above the DEM data as in figure 13. Again play with it.
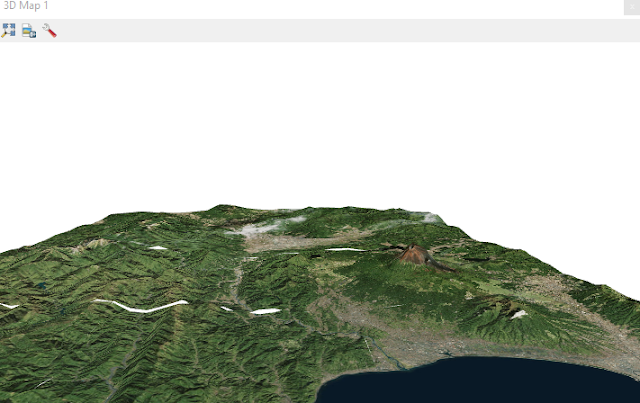 |
| Figure 13. DEM 3D with satellite imagery overlay |
That's all the tutorial how to visualize DEM data in 3D with QGIS. In the video below you can see how to do it from the beginning.
3D
QGIS
Tutorial


