In a sunny afternoon while having a cup of coffee in a local coffee shop with some friends, I got a question related to a post that I wrote sometimes ago about real time data visualization in QGIS for flight tracking application. He asked if it is possible to share plane's position on the map to other people. I answered of course, but using different approach i.e. Python for/and web programming instead of QGIS.
Later on I found an idea how to stream a map in QGIS to Youtube that could also answer the question. Because of that, in this post I will show you how to stream a map in QGIS to youtube using the same flight tracking case, so other people can see it.
How it Works?
Figure 1 below shows how the system works. If you notice, the system is an extended version of realtime data visualization in QGIS with three additional items which are capturing QGIS map canvas as an image and sending it to youtube stream through FFmpeg.
 |
| Figure 1. QGIS Map Youtube Streaming Schema |
I already discussed The first three components in another post (Almost Realtime Data Visualization in QGIS). If you don't read it, please do so to know how to get a dynamic map that shows realtime plane's position on the map like the figure 2.
 |
| Figure 2. QGIS Map |
Map Preparation
To make the map more informative to audience, the time information should be added to the map. So they know the time when the map was taken. Moreover when streaming to Youtube, sometimes it will receive no data from streaming software because of some reasons like internet connection speed instability. When streaming no data, Youtube will try to load new stream input and keep displaying the last streamed image. Therefore the time information is very important to let people know the time of streamed image.
To add time information into QGIS map canvas can be done with following ways:
1. From QGIS top menu select View, Decorations and choose Title Label as in figure 3.
 |
| Figure 3. Add Title Label |
2. The Title Label Decoration window will appear as in figure 4. Check Enable Title Label. In the Title label text type: [%now()%] to get current date and time. Then you can change the font size, background bar color and define the placement of the time label.
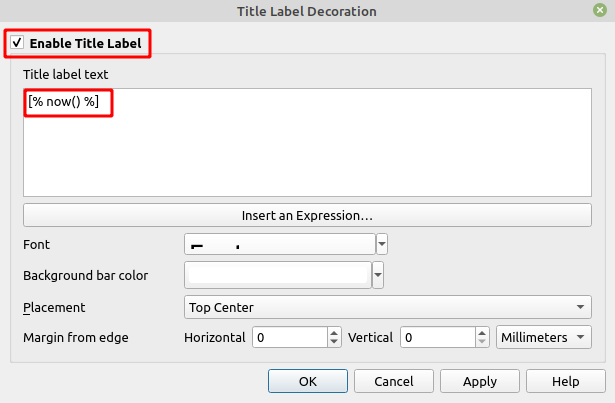 |
| Figure 4. Title Label Decoration Window |
Moreover with the Decorations menu we can also add other items like copyright text, logo, north arrow, etc. Just customize it as you like. My final map looks like figure 5.
 |
| Figure 5. Map with time, logo and copyright title |
Save QGIS Map Canvas as Image
In this step we will save the QGIS map canvas as an image. The process will be done repeatedly every certain amount of time. To do that the following code will be used:
#SPECIFY IMAGE SIZE
iface.mapCanvas().resize(QSize(1280,720))

#SAVE IMAGE FUNCTION
def save_image():
    path='/QGIS/map_canvas/'
    fn=path+'map_image.png'
    iface.mapCanvas().saveAsImage(fn,None,'PNG')

#SET TIMER
timer=QTimer()
timer.timeout.connect(save_image)
timer.setInterval(17000) #17000 ms/17 s
timer.start()
The code above consist of three main parts. The first line is to set the size of QGIS map canvas. The size of map canvas/image depends on the resolution of maximum Youtube video as follow:
- 2160p: 3840x2160
- 1440p: 2560x1440
- 1080p: 1920x1080
- 720p: 1280x720
- 480p: 854x480
- 360p: 640x360
- 240p: 426x240
The second part is a function which is called save_image. As it's name this function will save the map canvas view as an image with specified size to a path in PNG format.
The last one is the timer. In this part I defined a timer with an interval of 17000 ms or 17 seconds. When the timer is starting, it will repeat every 17 seconds to execute the save_image function. Therefore we will get an update of the map canvas every 17 seconds. You can set any interval you want, but I suggest not the same with the flight data layer to give a little time for the map canvas to complete rendering when getting new data. In my case, the rendering interval for flight data is 10 seconds.
Next, copy the code and paste it into a python map console as in figure 6. Don't forget to click the green play button to run the code. If you are new to QGIS Python console, please check out this tutorial Getting Started with QGIS Python Programming.
 |
| Figure 6. QGIS Python Console |
After hitting the play button the timer will start. To stop the timer, type in the console: timer.stop().
Streaming Map to Youtube
It's time to stream the map to Youtube. For streaming we are using FFmpeg software. If you don't have it, please install it first and make sure it works properly.
Before using FFmpeg, open your Youtube channel, then go to create (the camera icon), and select Go live as in figure 7.
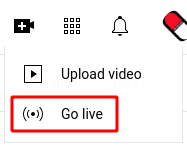 |
| Figure 7. Youtube Go live for video streaming |
 |
| Figure 8. Youtube streaming option |
 |
| Figure 9. Youtube studio |
ffmpeg -re -f image2 -stream_loop -1 -i map_image.png -f lavfi \
-i anullsrc=r=16000:cl=mono -framerate 15 -video_size 1280x720 \
-c:v libx264 -preset fast -b:v 2500k -bufsize 512k -vf "format=yuv420p" \
-g 20 -c:a aac -ar 44100 -threads 0 -f flv rtmp://a.rtmp.youtube.com/live2/--paste your stream key here--
- -f image2: File with image type
- -stream_loop -1: Set number of times input stream will be looped (-1=infinite loop)
- -i: Input file
- -re: Read input file in real time
- -anullsrc: A silent audio. Youtube requires audio otherwise it won't work.
- -framerate: Video frame rate in second
- -c:v: Video codec, here we use libx264
- -b:v: Video bit rate
- -bufsize: Buffer size
- -vf: Video format
- -g: GOP size which determines distance between keyframes
- -c:a: Audio codec
- -b:a: Audio bit rate
- -ar: Audio rate in Hz
If you want to learn more about FFmpeg stream please visit FFmpeg wiki and this interesting blog.
 |
| Figure 10. Map Streaming in Youtube |
Congratulations! Now you can stream your QGIS map to Youtube. Share it to friends, colleagues or on social media to get viewed.
That's all this tutorial about how to stream QGIS map to Youtube. We already learned how to prepare map by adding some items like title, copyright, logo, etc. Save QGIS map canvas into an image within a specified interval and stream it to Youtube using FFmpeg.
Before closing this tutorial, I just want to share a little experience when streaming the map. Sometimes Youtube receives no data from FFmpeg and I have to rerun the FFmpeg command. I think it happened due to my internet speed stability. If you have not so good internet connection I suggest streaming with medium resolution and lowering video frame rate or video rate. Play to tweak the FFmpeg options and see how it goes. Overall I hope you can learn something from this post and have a nice stream :).
Watch the video tutorial