Creating a map layout is a common task at the end of a GIS assignment. It is used to present the output of the final result as a means to communicate with users in order to get information, knowledge or insight from a map. Making a map layout is quite easy in any GIS software including QGIS. But on the other hand it could be a tedious job when we have to generate such a large number of maps. Moreover in making a layout map, frequently we do a repeating job by adding some common cartographic items such as scale bar, legend, map title and so on. So, what if we can make it automatically? Certainly it will give many benefits to make a map layout faster.
In this PyQGIS tutorial I will discuss how to make a map layout automatically using Python script in QGIS. In this tutorial you will learn how to add a map into a layout, then adding some items like map title, legend, north arrow, scale bar and picture.
Getting Started (Map Preparation)
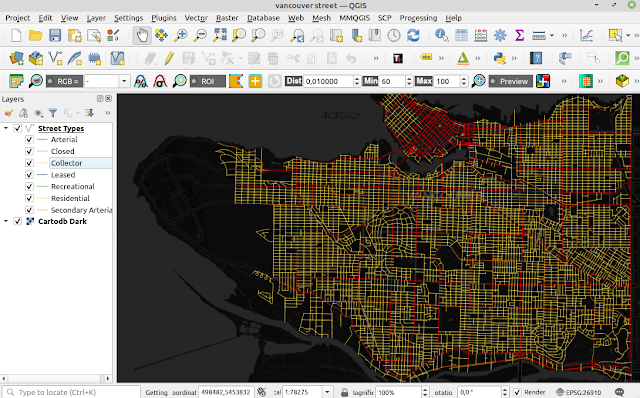
First step before making a layout is preparing a map in QGIS map canvas. For this tutorial I prepared a street map in the city of Vancouver as in Figure 1. You can prepare your own map, but if you want to make it like mine, the street data can be downloaded from Vancouver Open Data and Cartodb Dark basemap can be added into the map canvas using Tile+ Plugin.
 |
| Figure 1. Preparing Map in QGIS |
Automating Map Layout Composition
Now let's compose a map layout automatically with Python. First define a current project instance and initiate a print layout with default setting in A4 paper size using the following code.
project=QgsProject.instance()
layout=QgsPrintLayout(project)
layout.initializeDefaults()
The code above will create a layout page on the fly. If you want to add it in the project, use this code.
layout.setName("Street Map Layout")
project.layoutManager().addLayout(layout)
The layout will be added to the project's layout as in figure 2.
 |
| Figure 2. Project Layouts |
Add A Map Frame to Layout
We had created an empty layout. Now let's add map items. Firstly we will add a map frame into the layout with this code.
1 2 3 4 5 | map=QgsLayoutItemMap(layout) map.setRect(10,10,10,10) map.zoomToExtent(iface.mapCanvas().extent()) map.attemptMove(QgsLayoutPoint(5,20,QgsUnitTypes.LayoutMillimeters)) map.attemptResize(QgsLayoutSize(285,180, QgsUnitTypes.LayoutMillimeters)) |
In the first line we define a map layout item with QgsLayoutItemMap class. Then in the second line a rectangular frame is set which takes four integer arguments. It doesn't matter what number it is, it is just used to determine the shape. Next is the method to zoom the map canvas to an extent using zoomToExtent method. In the fourth line we move the map to a position (x,y) with attemptMove method. Map Layout coordinate uses screen coordinate where the origin is on the top left of the page and the maximum coordinate on bottom right of the page. Lastly we resize the map frame size using attemptResize with the size in millimeter units as defined in QgsUnitTypes.
Executing the code, we will get a map layout like figure 3.
 |
| Figure 3. Layout with a Map Frame |
Add Map Title
Now let's add a title for the map, so people know what it is about. To add a title we use QgsLayoutItemLabel class. Next we set a text with the setText method and in the third line we determine font type, size and weight with setFont. In figure 4 can be seen a title was added to the map layout.
1 2 3 4 5 6 | title=QgsLayoutItemLabel(layout) title.setText("Vancouver City Street Map") title.setFont(QFont("Arial",28,QFont.Bold)) title.adjustSizeToText() layout.addLayoutItem(title) title.attemptMove(QgsLayoutPoint(80,5,QgsUnitTypes.LayoutMillimeters)) |
 |
| Figure 4. Layout with a Title Map |
Add Map Legend
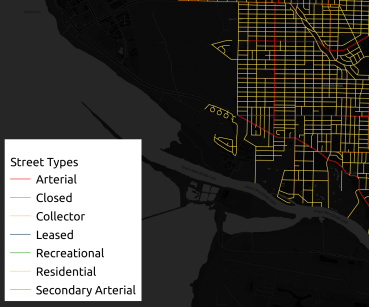
As you can see in the map, the street network has different colors to differentiate each street use. In a map layout, information of a data can be found in a legend item. The code below is used to add street legend. The data layer was selected from the current project's instance by it's name with mapLayerByName method. In the second and third lines the selected layer was added to the QGIS layer tree.
In figure 5 can be seen that the street legend was added to the map layout.
1 2 3 4 5 6 7 8 | layer = QgsProject.instance().mapLayersByName('Street Types') root = QgsLayerTree() root.addLayer(layer[0]) legend = QgsLayoutItemLegend(layout) legend.model().setRootGroup(root) legend.setLinkedMap(map) layout.addLayoutItem(legend) legend.attemptMove(QgsLayoutPoint(8,140,QgsUnitTypes.LayoutMillimeters)) |
 |
| Figure 5. Layout with a Legend |
Add Scale Bar
To give a user an actual size perspective, a scale should be added to the layout. To add a scale, the QgsLayoutItemScaleBar class is used. To determine a type of scale bar, the setStyle method is applied . There are some types of scale bar such as: Numeric, Single Box, Double Box, Line Ticks Middle, Line Ticks Down and Line Ticks Up. In line 3-4 is used to customize scale's font. The default color of the scale bar is black, which is quite similar to the basemap. I changed it to blue with the setFillColor method in line 5.
1 2 3 4 5 6 7 8 9 10 11 12 13 | scale=QgsLayoutItemScaleBar(layout) scale.setStyle('Single Box') scale.setFont(QFont("Arial",15)) scale.setFontColor(QColor("White")) scale.setFillColor(QColor("Blue")) scale.applyDefaultSize(QgsUnitTypes.DistanceMeters) scale.setMapUnitsPerScaleBarUnit(1000.0) scale.setNumberOfSegments(2) scale.setUnitsPerSegment(1*1000.0) scale.setUnitLabel("Km") scale.setLinkedMap(map) layout.addLayoutItem(scale) scale.attemptMove(QgsLayoutPoint(5,70,QgsUnitTypes.LayoutMillimeters)) |
QgsDefaultSize in line 6 is used to define an unit to the scale bar. This method is used when we want to define a unit which is different from a map canvas unit. For example, a map canvas is in degrees, but we want the scale in meter units, therefore we use QgsUnitTypes.DistanceMeters. To format the scale bar, like scale bar unit, number of segments, unit per segment including unit label, can be seen in lines 7-10.
Add North Arrow
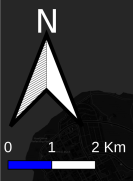
Next item which will be added into the map layout is the north arrow for map orientation. To add a north arrow the QgsLayoutItemPicture is used. Line two in the following code is for setting a picture format, for this I used SVG format. To specify the path of the picture can be done with the setPicturePath method. In line five the picture is resized to 500x500 pixels.
1 2 3 4 5 6 | north=QgsLayoutItemPicture(layout) north.setMode(QgsLayoutItemPicture.FormatSVG) north.setPicturePath("/usr/share/qgis/svg/arrows/NorthArrow_04.svg") north.attemptMove(QgsLayoutPoint(8, 25, QgsUnitTypes.LayoutMillimeters)) north.attemptResize(QgsLayoutSize(*[500,500], QgsUnitTypes.LayoutPixels)) layout.addLayoutItem(north) |
Figure 6 shows the layout with scale bar and north arrow.
 |
| FIgure 6. Layout with Scale Bar and North Arrow |
Add Logo
Last item to be added into a map layout is a logo. The code to add a logo is similar to adding a north arrow but with a different picture format. Here I used the PNG format as seen in the code below.
1 2 3 4 5 6 | pic=QgsLayoutItemPicture(layout) pic.setMode(QgsLayoutItemPicture.FormatRaster) pic.setPicturePath("/pic/logo/vc_logo.png") pic.attemptMove(QgsLayoutPoint(237, 175, QgsUnitTypes.LayoutMillimeters)) pic.attemptResize(QgsLayoutSize(*[600,600], QgsUnitTypes.LayoutPixels)) layout.addLayoutItem(pic) |
We had added all the most common map items into a print map layout automatically using Python. The ending layout looks like figure 7.
 |
| Figure 7. Final Layout |
Export Layout into PDF or Image
Before closing this tutorial, let's export the layout into a PDF or Image. To export into PDF or image the QgsLayoutExporter class is used. The path and name of the respective exported file must be specified first. Depending on the output format, we use exportToPdf or exportToImage method as in the following code.
1 2 3 4 5 6 7 8 9 10 | output_path="/QGIS/layout-export-pyqgis" exporter=QgsLayoutExporter(layout) #EXPORT TO PDF pdf_path=output_path+'/pdf_map.pdf' exporter.exportToPdf(pdf_path,QgsLayoutExporter.PdfExportSettings()) #EXPORT TO IMAGE img_path=p+'/img_map.png' exporter.exportToImage(img_path,QgsLayoutExporter.ImageExportSettings()) |
That's all this tutorial on how to automate map layout in QGIS using Python. We had learnt how to add the most common map items like map frame, title, scale bar, legend, north arrow and logo. Moreover there are more items that can be added into a map layout like shape, 3D Map, Marker, and so on. Check out the QGIS API Documentation to learn more. For other interesting PyQGIS tutorials please visit PyQGIS Tutorial Series. Thanks for reading!