Consequences of human activities on Earth leave an indelible mark on our planet's weather patterns, with carbon dioxide (CO2) emissions, primarily from burning fossil fuels for energy, industrial processes, and transportation, playing a central role. These emissions accumulate in the atmosphere, creating a 'blanket' that traps heat, resulting in global warming. As temperatures increase, the likelihood of extreme weather events rises. Therefore, weather forecasting and monitoring is of utmost importance in understanding and responding to these changes.
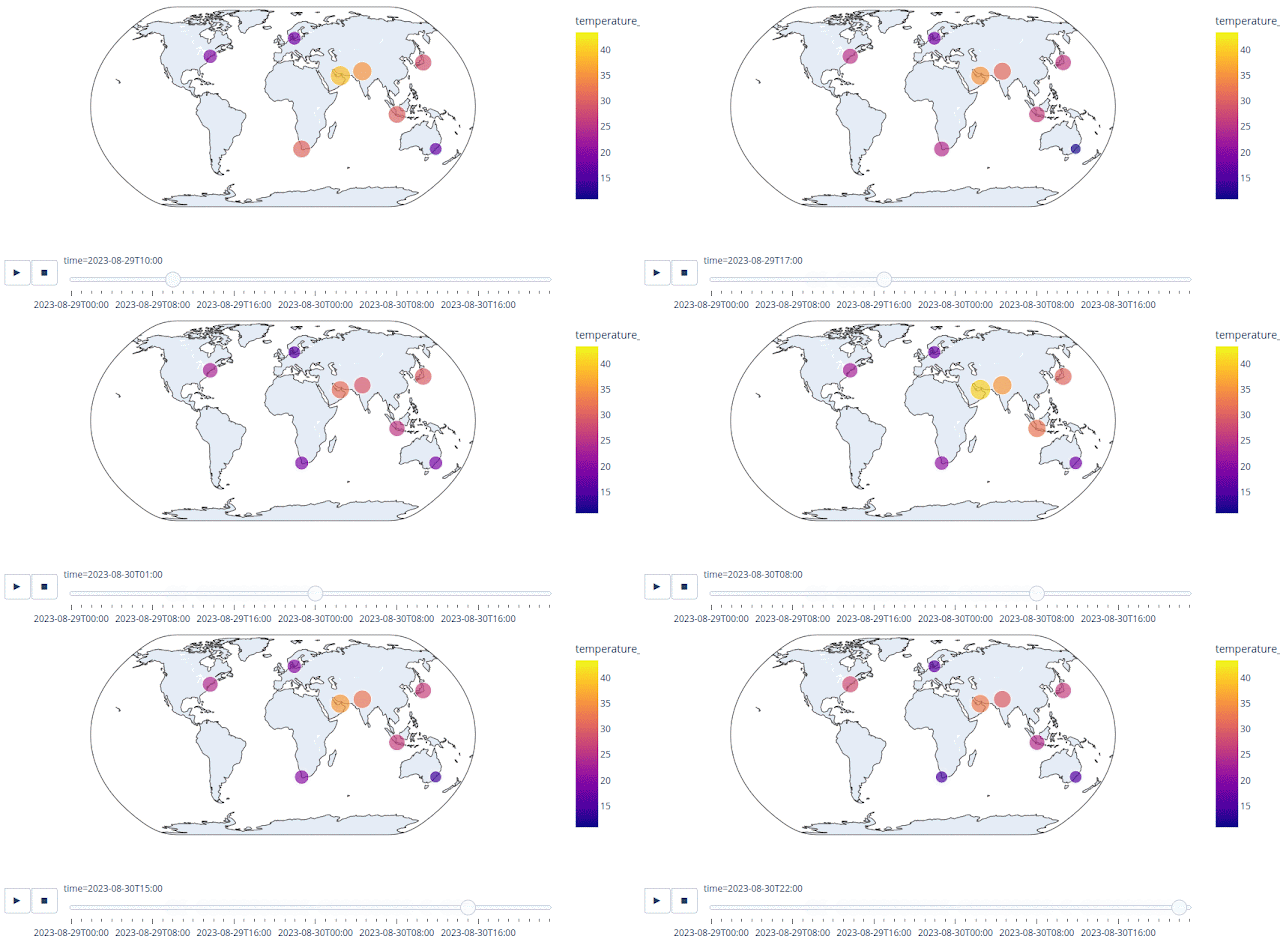
In this tutorial I will explain how to get and plot current weather and forecast at any city in the world using Python. At the end of this tutorial we will have a weather forecast for a variable such as temperature, humidity, cloud cover, etc, which is plotted on a map or in a graph as shown in the figure 1 and 2.

|
|
Figure 1. Map of Temperature Forecast of Several Cities in the World |

|
| Figure 2. Bar chart of Temperature Forecast of Several Cities in the World |
Getting Weather Data
The weather data for this tutorial is coming from Open Meteo. Open Meteo is an open-source weather API that offers free access for non-commercial use. To provide the most suitable weather models for a specific location, including ensuring accurate and reliable forecasts, Open-Meteo partners with national weather services with high resolution, ranging from 1 to 11 kilometers. There is no API key required to use this service. You just need a correct API URL to retrieve the data.
Depends on your need, Open Meteo provides a lot of weather variables such as: temperature, humidity, pressure, cloud cover, wind direction and a lot more. Please check the weather forecast API page to see all available weather variables.
As example you want to get a temperature of New York city from 29th August 2023 until 30th August 2023. The API URL will look like this:
https://api.open-meteo.com/v1/forecast?latitude=40.7143&longitude=-74.006&hourly=temperature_2m¤t_weather=true&timezone=GMT&start_date=2023-08-29&end_date=2023-08-30
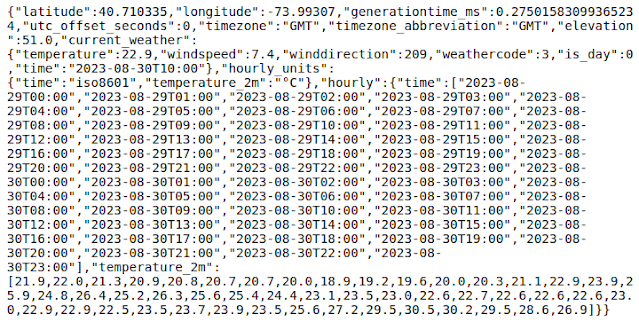
In the URL API above you will notice that the location of New York city is defined with a Geographic coordinate in Latitude and Longitude. Then the temperature variable name is temperature_2m, which means the air temperature at 2 meters above ground and at the is defined start and end date.
Copy the API URL and paste it into a browser. You should get a response as below.

|
|
Figure 3. Open Meteo Weather API Response |
Process The Weather Data
We already have the response data, now let's parse it to make it more readable for user. Firstly let's get the current weather data.
Since the response is in JSON format with a dictionary data structure, the
current data can be retrieved from the response using the key:
current_weather. The code below is used to get the current weather data. From the code you can see some modules are required: request, json and pandas. the request and json modules are used to fetch the data and store it in a JSON format. Pandas is used to convert the data into pandas dataframe.
1 2 3 4 5 6 7 8 9 10 11 | #IMPORTING LIBRARY import requests import json import pandas as pd #GET CURRENT WEATHER DATA url_data="https://api.open-meteo.com/v1/forecast?latitude=40.7143&longitude=-74.006&hourly=temperature_2m¤t_weather=true&timezone=GMT&start_date=2023-08-29&end_date=2023-08-30" response=requests.get(url_data).json() #get data response in json weather_df=pd.DataFrame(response) current_weather=weather_df['current_weather'] print(current_weather) |
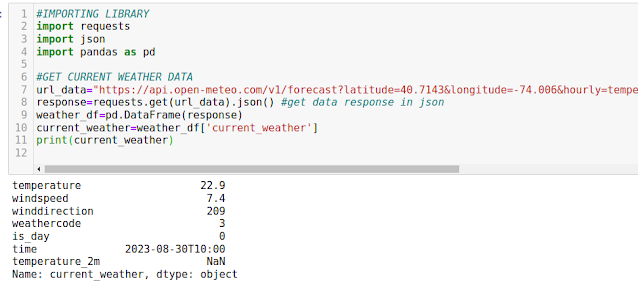
Running the the code above you should get a result as following:
 |
| Figure 4. Getting Current Weather Data |
Get Weather Data for Multiple City
Using the code above we get the weather data for a single city. Now let's get the data for several cities. For example we want to get weather data for New York, Cape Town, Jakarta, Copenhagen, Sydney, New Delhi, Tokyo and Dubai. Do we need to a define a different API URL for each city. The answer is YES, but we can do it in a loop instead of doing it one by one.
The code below is used for getting weather data for multiple cities as mentioned above. In the code we need two additional modules: numpy and time. Then we create variables that stored each city's coordinate. Some API URL parameters can can defined in the code such as start and end date at line 18-19. Weather variable can be set at line 22. Then using each key in the city dictionary data, we do looping to fetch weather data for each city. Lastly at the end we join all data.
1 2 3 4 5 6 7 8 9 10 11 12 13 14 15 16 17 18 19 20 21 22 23 24 25 26 27 28 29 30 31 32 33 34 35 36 37 38 39 40 41 | import numpy as np import time #CITY COORDINATE LAT,LONG new_york=(40.710335,-73.99307) cape_town=(-34.0,18.5) jakarta=(-6.1818,106.8223) copenhagen=(55.6759,12.5655) new_delhi=(28.6358,77.2245) sydney=(-33.9461,151.1772) tokyo=(35.6895,139.6917) dubai=(25.0772,55.3093) city={'New York':new_york,'Cape Town':cape_town,'Jakarta':jakarta,'Copenhagen':copenhagen, 'Sydney':sydney,'New Delhi':new_delhi,'Tokyo':tokyo,'Dubai':dubai} #START AND END DATE YYYY-MM-DD start_date='2023-08-29' end_date='2023-08-30' #WEATHER VARIABLE variable="temperature_2m" #change this for other variable #GETTING WEATHER FORECAST USING OPEN METEO API FOR EACH CITY data_list=[] for i in city.keys(): url_data='https://api.open-meteo.com/v1/forecast?latitude='+str(city[i][0])+'&longitude='+str(city[i][1])+'&hourly='+variable+'&timezone=GMT&start_date='+start_date+'&end_date='+end_date response=requests.get(url_data).json() #get data response in json df=pd.DataFrame(response['hourly']) #convert data to pandas dataframe n_data=len(df) lat,lon=[city[i][0]]*n_data,[city[i][1]]*n_data #generate lon,lat for dataframe city_name=[i]*n_data df['lat']=lat df['lon']=lon df['city']=city_name #add city name to dataframe data_list.append(df) time.sleep(5) #pause 5 seconds before getting a new data #JOIN ALL DATAFRAMES data_con=pd.concat(data_list,axis=0) data_con.head() |
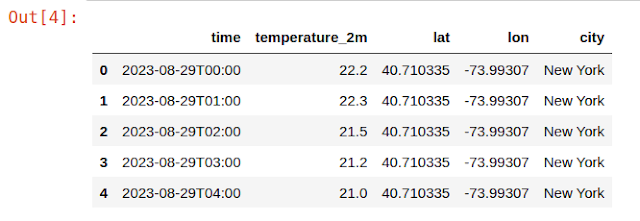
Running the code you should get a pandas data frame as in figure 5.
 |
| Figure 5. Weather Data in Pandas Data Frame |
Plotting Weather Data on A Map
Congratulation! You already have all weather data for those cities. Of course it's somewhat difficult to see the data in a table rows. To make it easier to see and more interesting, let's visualize it by plotting the data into a map with a slider animation.
For plotting the data, we are using the Plotly library. So you need to install it first, if you don't have it. The code below is used to plot the data on a map. Running the code you should get a result as in figure 1 above.
1 2 3 4 5 6 7 8 9 10 11 12 13 14 15 | #PLOTTING ON A MAP import plotly.express as px #import plotly express maxs=data_con[variable].max() mins=data_con[variable].min() fig = px.scatter_geo(data_con, lat="lat",lon="lon", color=variable, # which column to use to set the color of markers hover_name="city", # column added to hover information size=variable, # size of markers projection="natural earth", #map projection animation_frame="time", #column use for animation frame range_color=[mins,maxs], #colorbar range title="City World Weather Forecast" #plot title ) fig.show() |
Plotting Weather Data in A Bar Chart
Lastly let's plot the weather data in a bar chart also with a slider animation, therefore we can observe how the temperature change over time in each city. Using the Plotly module is quite easy to create a bar chart with a slider animation as in the code below. After execute the code you should get the result as in figure 2 above.
1 2 3 4 | #PLOTTING WEATHER DATA IN A BAR CHART fig = px.bar(data_con, x="city", y=variable, color="city", animation_frame="time", range_color=[5,40],range_y=[mins,maxs],text=variable) fig.show() |
That's all this tutorial on how to get and plot weather data at any city in the world using Python using Open Meteo weather data API. In this tutorial you learnt how to get the weather data, process it in Python, plot the weather data into a map and in a bar chart. I hope this tutorial is useful. Thank you!
Anyway I provide the code in a notebook based on request. If you're interested, please make your request here.